This is a continuation of the
Process Intensifier - Optimization with CFD: Part 1 paper.
It is always important to know the pressure drop of items in
a pipeline.
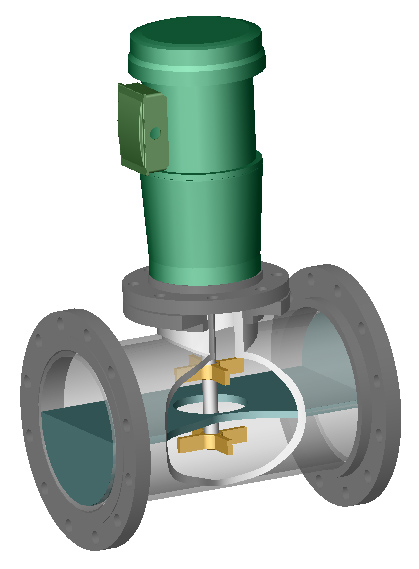
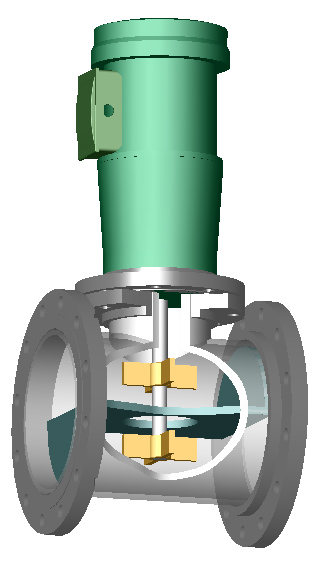
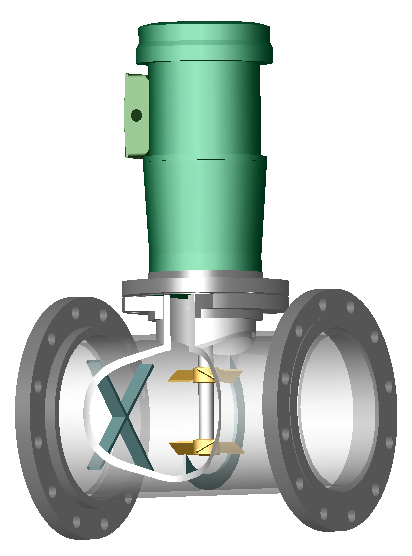
These pressure drops were measured over a 78.7 inch (2 m) pipe section, which
included the Process Intensifier. The shaft of the mixer was in the exact middle
of the pipe section. Therefore, there were almost 4 pipe diameters upstream and
downstream of the mixer for this study.
Pressures computed in ACUSOLVE are formulated using equal order interpolation
with the velocity variables yielding a consistent structure, which permits and
facilitates the total formulation stability and convergence proofs. Hence, along
with the velocities, the pressures have the identical solution accuracy,
stability and convergence characteristics, including local and global
conservation, as the primary variables for velocity. ACUSOLVE admits a variety
of boundary conditions, ranging from specified velocity and mass flux
conditions, to being totally determined and computed by the solution. ACUSOLVE
can even handle the case where the momentum and energy supplied by a pumping
impeller determines the inflow / outflow of a system, including both velocity
and pressure determination. A related characteristic is that the pressure
boundary condition does not make any requirement of velocity specification, and
that in the general case, any given surface could have flow going in both
directions. In the case of the Process Intensifiers, designs may be developed
that either introduce a pressure drop, or a pressure boost (see Part 2). The
accuracy of ACUSOLVE permits the proper evaluation of the pressure state of the
system.
| 1100 GPM |
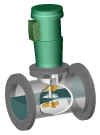
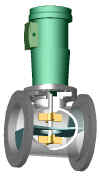
Radial Process Intensifier |
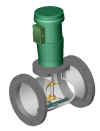
Axial Process Intensifier |
| Lightnin |
 |
 |
| |
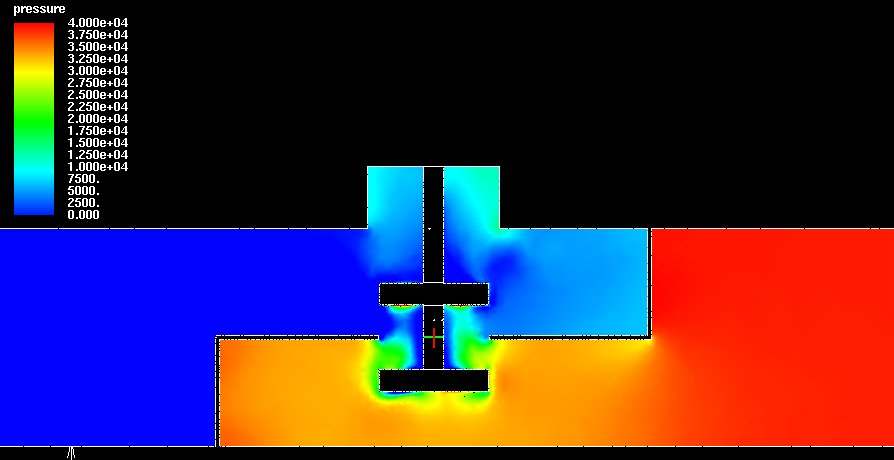
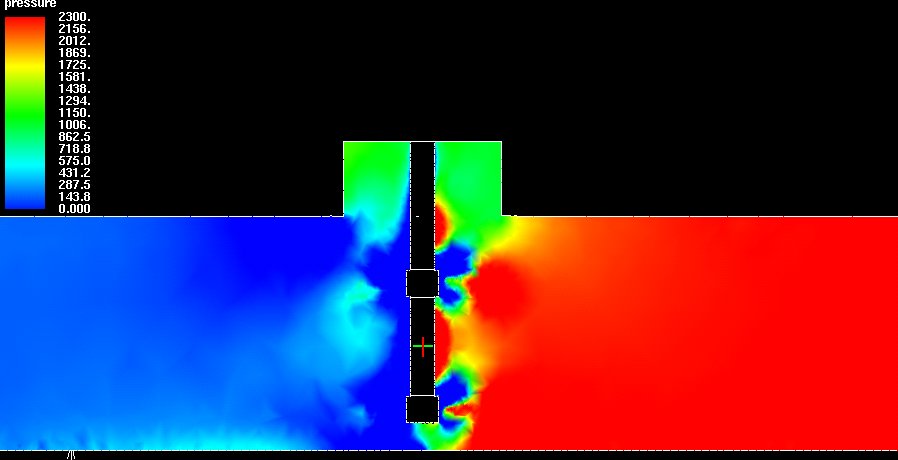
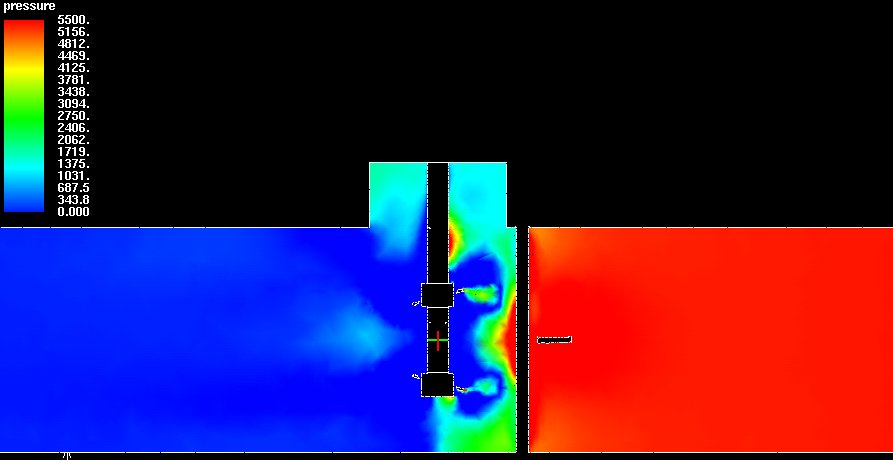
Red = 40,000 Pa = 5.8 psig |
Red = 2,300 Pa = 0.3 psig |
| Hayward Gordon |
 |
 |
| |
Red = 45,000 Pa = 6.5 psig |
Red = 5,500 Pa = 0.8 psig |
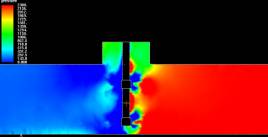
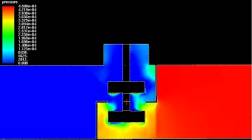
| Figure
8: Pressure drop determination in the Process Intensifiers at 1100
GPM (250 m3/hr). Click on any picture for a larger view. |
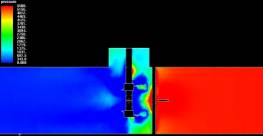
The pressure drops were determined by looking at the pressure distribution
plots (Figure 8) of each device. The following pictures show the local pressure
distributions in a vertical plane directly through the middle of the pipe at
1100 GPM (250 m3/hr) flow. The scale is not the same for each device, but red
always corresponds with the highest pressure (inlet) and blue always corresponds
with the outlet pressure. Blue is in each case = 0, meaning that this shows
pressure above the outlet pressure (gauge pressure). This form of representation
makes it very easy to determine the pressure drop. The numbers are in Pascals.
The maximum value on the scale (red) is thus the pressure drop from inlet to
outlet, which is over a 78.7-inch (2 m) section. The values of all the pressure
drops are in Table 4.
| PSI (Pa) |
Radial Process Intensifiers |
Axial Process Intensifiers |
| |
Lightnin LTR |
Hayward Gordon HGR |
Lightnin LTA |
Hayward Gordon HGA |
| Click on any picture for a bigger picture |
 |
 |
 |
 |
| 650 GPM |
2.8 (19305) |
3.9 (26890) |
0.15 (1034) |
0.4 (2758) |
| 1100 GPM |
5.8 (39990) |
6.5 (44816) |
0.3 (2068) |
0.8 (5516) |
| Table 4: Pressure drops across the
Process Intensifier in PSI (Pa). |
The pressure drops (Table 4) appear to be directly related to the power
consumption of the impellers but are obviously a stronger function of the
overall flow rate through the pipe. The pressure drops at 650 GPM (148 m3/hr)
are approximately ½ the values at 1100 GPM (250 m3/hr). The LTA at 1100 GPM
(250 m3/hr) is particularly low probably because it is "flooded" by
the cross flow and has little affect on disturbing the flow through the pipe.
The pictures for 650 GPM (148 m3/hr) is not shown.
Continue with Pressure
Distribution
or
Go back to Results
or
Go back to Title Page
|