|
|
|
|
Eddy Viscosity
|
This is a continuation of the
Process Intensifier - Optimization with CFD: Part 1 paper.
The eddy viscosity can be understood to be an indication of a turbulence magnifier. Looking at relative magnitudes of this value give an indication of the level of turbulence contained within the enclosed volume. What becomes important is the size and magnitude of the volume. For this study, the 50% level of eddy viscosity was arbitrarily chosen as a discriminator to illustrate a concept. Hence, the iso-surface corresponding to that value was determined. It should be realized that contained within this volume is a higher turbulence measure, and outside the volume is lower. The implication to mixing becomes the size of the volume relative to how long particles are resident within.
 |
 |
 |
 |
 |
 |
 |
 |
 |
 |
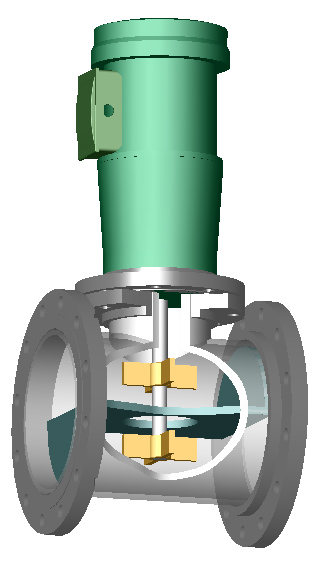
| HGR 650 GPM 1750 RPM Water |
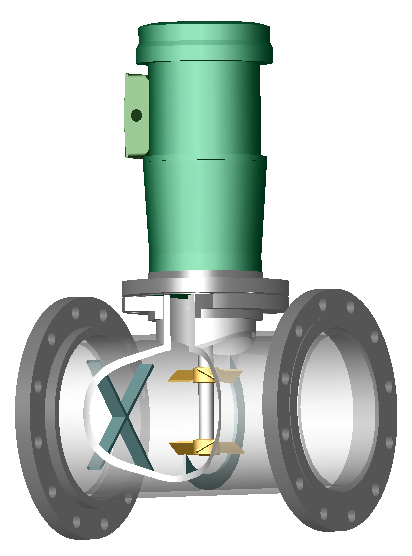
HGA 650 GPM 1750 RPM Water |
| Figure
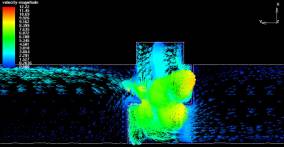
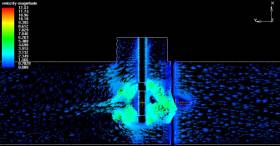
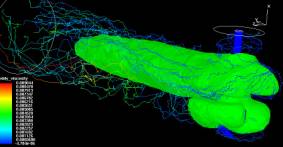
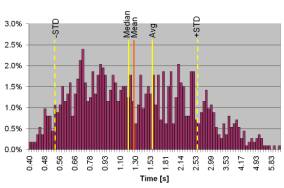
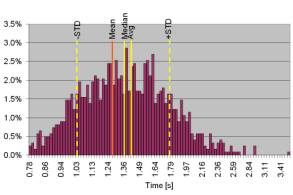
23: Characteristics of the HGR and HGA: Velocity vectors, mixing
tracers, eddy viscosity, and RTD plots. Internals other than the
impellers and shaft are not shown. |
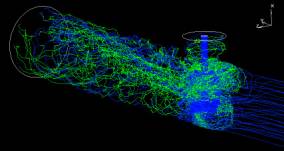
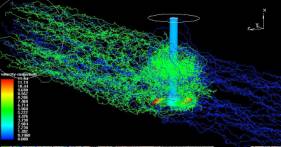
Figure 23 shows 4 different types of plots. The top and bottom ones have already been discussed. The second set is "mixing" tracer plots. Two sets of discrete tracer particles are injected to see how them mix. The blue comes from the beginning of the pipe and are uniformly distributed, just like the flow pattern tracers above. The green particles are added at the respective injection port. In the case of the HGR, it was below the lower impeller. In the case of the HGA, it was injected through a pipe just in front of each impeller. The colors this time have nothing to do with residence time. In both cases there is a fairly good mixture of these particles.
The 3rd set is the Eddy Viscosity plots. The light green object is the iso-surface of Eddy Viscosity. Everything inside the surface has a higher Eddy Viscosity and everything outside it will be less. The eddy viscosity has the same units as the kinematic viscosity, m2/s. This value when multiplied by the proper (Reynolds averages Navier Stokes - RANS) strain rate tensor produces the amount of "Reynolds shear" attributed to turbulence and then applied in the momentum equation (this is a very loose interpretation).
|
|
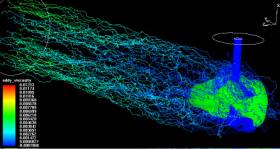
The maximum Eddy Viscosity of the HGR is 0.009 m2/s. The green
surface represents 50% of that or 0.0045 m2/s. Everything within this
surface is higher. The maximum Eddy Viscosity of the HGA is 0.0125 m2/s.
The green surface represents 50% of that or 0.0063 m2/s. Note that
although the 50% value of Eddy
Viscosity is slightly higher than the HGR, the volume of it is much smaller. All
of the tracer particles of the HGR pass through this high-energy region, which
is very good. Most of the tracer particles pass through the high-energy region
of the HGA, too, since the location of the two injection ports is nearly within
this zone. If you look closely to the HGA Eddy Viscosity Plot in Fig. 23, you
will notice that part of the bottom impeller is not within the high-energy zone.
This is the suction side of the up-pumping impeller. Since this impeller is
partially visible, some of the tracer particles are going to miss this zone.
There is a high concentration of blue particles
in this area. This explains why so many particles are arriving at the end of the
pipe so soon.
|
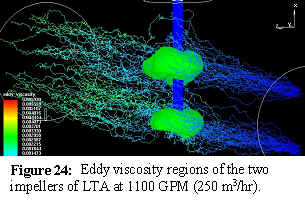
On the other hand, the size of the Eddy Viscosity iso-surface volume is much smaller for the two impellers of the LTA. Here is the case where two injection ports are upstream of the LTA. We can clearly see that some of the particles are completely missing these high-energy areas. Hence the poorer mixing. We can also see that the green particles (3 second residence times) are coming out of these surfaces. The maximum Eddy Viscosity of the LTA is only 0.006 m2/s. That means the green areas represent the surface where the values are 0.003 m2/s. This is much less than the other two examples. If we had chosen the same value, these surfaces would have been even smaller.
Even without an in-depth study of this characteristic, this shows that when mixing in a second component, it is best when it is injected within this high-energy volume. Obviously, larger volumes have a higher probability of capturing more particles, and larger volumes retain the particles longer. Perhaps the LTA would have worked better had the injection point been inside the green volume, just like the HGA.
|
|
Continue on with Non-Newtonian Xanthan Gum application or
Go back to Results or
Go back to the Title Page
|
|
|